



 10 minutes to read
2026-07-28
Nadia Anwar
Engulfing Candle Pattern Explained: How to Spot and Trade It


Scroll through any price chart for long enough, and certain candle shapes start repeating themselves right before the market changes direction. One of the most recognizable is the engulfing candle — a two-candle formation traders have relied on for generations to spot a potential shift in momentum. It's simple to identify once you know what to look for, but reading it correctly takes a bit more nuance.
So let’s break down what an engulfing candle actually is, the difference between its bullish and bearish forms, how reliable the pattern really is, and how to combine it with other tools so it becomes part of your trading strategy.
What Is an Engulfing Candle?
An engulfing candle is a two-candle pattern where the second candle's body completely covers, or "engulfs," the body of the candle before it. If the first candle is small and the second is significantly larger and moves in the opposite direction, that shift often signals the buyers or sellers previously in control have suddenly lost the upper hand.
The pattern gets its name literally: picture a small red candle sitting inside the outline of a much larger green candle drawn around it, or vice versa. That visual swallowing-up of the previous session's range is what makes the pattern easy to spot, even on a quick glance at a chart.
How an Engulfing Candle Forms
For a real engulfing pattern to form, a few conditions need to line up:
- Two consecutive candles form, typically at the end of a defined trend.
- The first candle has a relatively small body, showing indecision or a slowing trend.
- The second candle opens on the opposite side of the first candle's close and finishes beyond its opening price, so its body fully covers the prior candle's body.
- The direction of the second candle is opposite to the trend that came before it.
It's worth noting that it's the body of the candle — the space between open and close — that needs to be engulfed, not necessarily the “wicks”. A pattern where only the wicks overlap, but the bodies don't fully cover one another, isn't a true engulfing formation.
Bullish vs. Bearish Engulfing Candle Patterns
An engulfing candle can point in one of two directions, and knowing which one you're looking at changes what it's telling you about the market.
What a Bullish Engulfing Candle Signals
A bullish engulfing pattern shows up after a downtrend. The first candle is a smaller red (bearish) candle, followed by a larger green (bullish) candle whose body completely covers it. This suggests sellers pushed the price down initially, but buyers then stepped in with enough force to erase that entire move and then some.
Traders often read this as an early sign that downward momentum is fading and an upward reversal could be starting, especially when it appears near a known support level, since that combination adds extra weight to the idea that the price may be turning.
What a Bearish Engulfing Candle Signals
A bearish engulfing pattern is the mirror image. It forms after an uptrend, with a smaller green candle followed by a larger red candle that swallows it whole. Here, buyers had been pushing the price up, but sellers came in strong enough to erase those gains within a single session.
This pattern is often treated as a warning that an uptrend may be losing steam, especially near a resistance level. If you’re watching for a shift from bullish to bearish conditions, it's often one of the clearer visual cues available on a candlestick chart.
How Reliable Is the Engulfing Candle Pattern?
Like any single indicator, the engulfing candle isn't foolproof, and its reliability shifts with context. A few factors tend to make the signal more sound:
- Trend strength beforehand. A pattern after a strong, well-established trend carries more weight than one in a choppy, directionless market.
- Volume. Higher-than-average volume on the candle itself often reinforces the idea that a genuine shift in sentiment is taking place, rather than a brief blip.
- Location on the chart. A bullish engulfing candle near support, or a bearish one near resistance, means more than the same pattern mid-range with no nearby levels.
- Timeframe. Patterns on longer timeframes, like daily or four-hour charts, are generally more significant than the same shape on a one-minute chart, where noise is far more common.
None of this means the pattern will always play out as expected. Like every candlestick formation, it's a probability tool, not a guarantee — which is exactly why it works best alongside confirmation from other indicators rather than as a standalone trigger.
Spotting an Engulfing Candle Using Chart Indicators And Tools
Recognizing an engulfing pattern gets easier with practice, but pairing it with the right charting tools makes it far more reliable to trade in real time.
Support and resistance lines are the most natural companions, since they show whether the engulfing candle is forming at a meaningful price level or in the middle of nowhere. Trend lines help confirm whether the broader direction being reversed is actually strong enough to matter.
Momentum indicators, like RSI or the Stochastic oscillator, are useful too — an engulfing candle lining up with an overbought or oversold reading adds another layer of confirmation. Moving averages serve a similar purpose, helping judge whether the candle is fighting a strong trend or confirming a shift already underway.
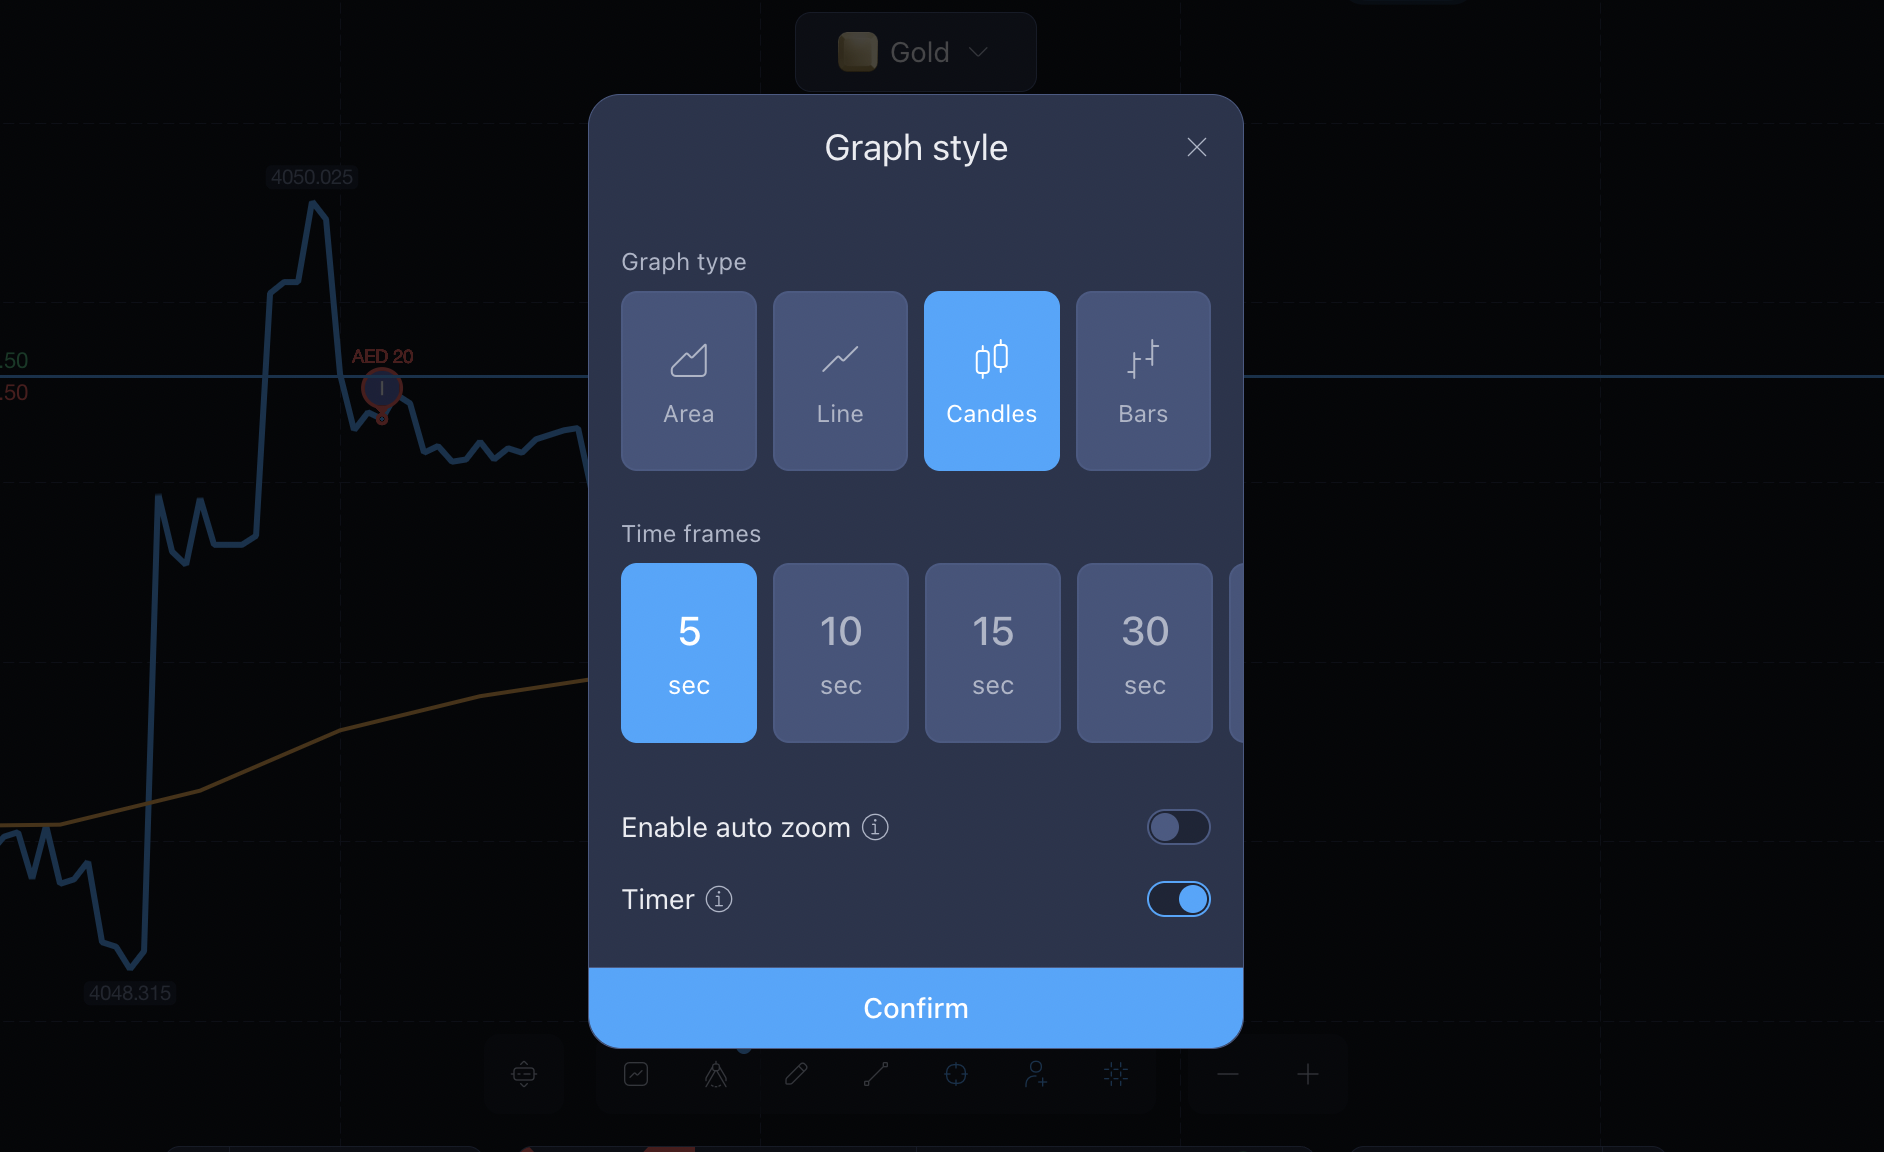
Using ExpertOption's Indicators And Charting Tools For Technical Analysis
ExpertOption's trading interface is built with this kind of analysis in mind. The platform offers multiple chart types — candlestick, bar, line, and area views — so you can switch between them depending on whether you want individual price action or a broader sense of the trend. Plus, ExpertOption has a bunch of built-in indicators, including moving averages, RSI, MACD, Bollinger Bands, Stochastic, and Parabolic SAR, letting you layer momentum and trend confirmation onto any engulfing candle you spot without switching tools.
Trend lines and adjustable timeframes allow you to check whether a pattern on a shorter chart holds up when you zoom out to a longer one. For anyone learning to read candlestick patterns, having all of this within the same expert option app or web platform makes it easier to confirm a signal before acting on it.
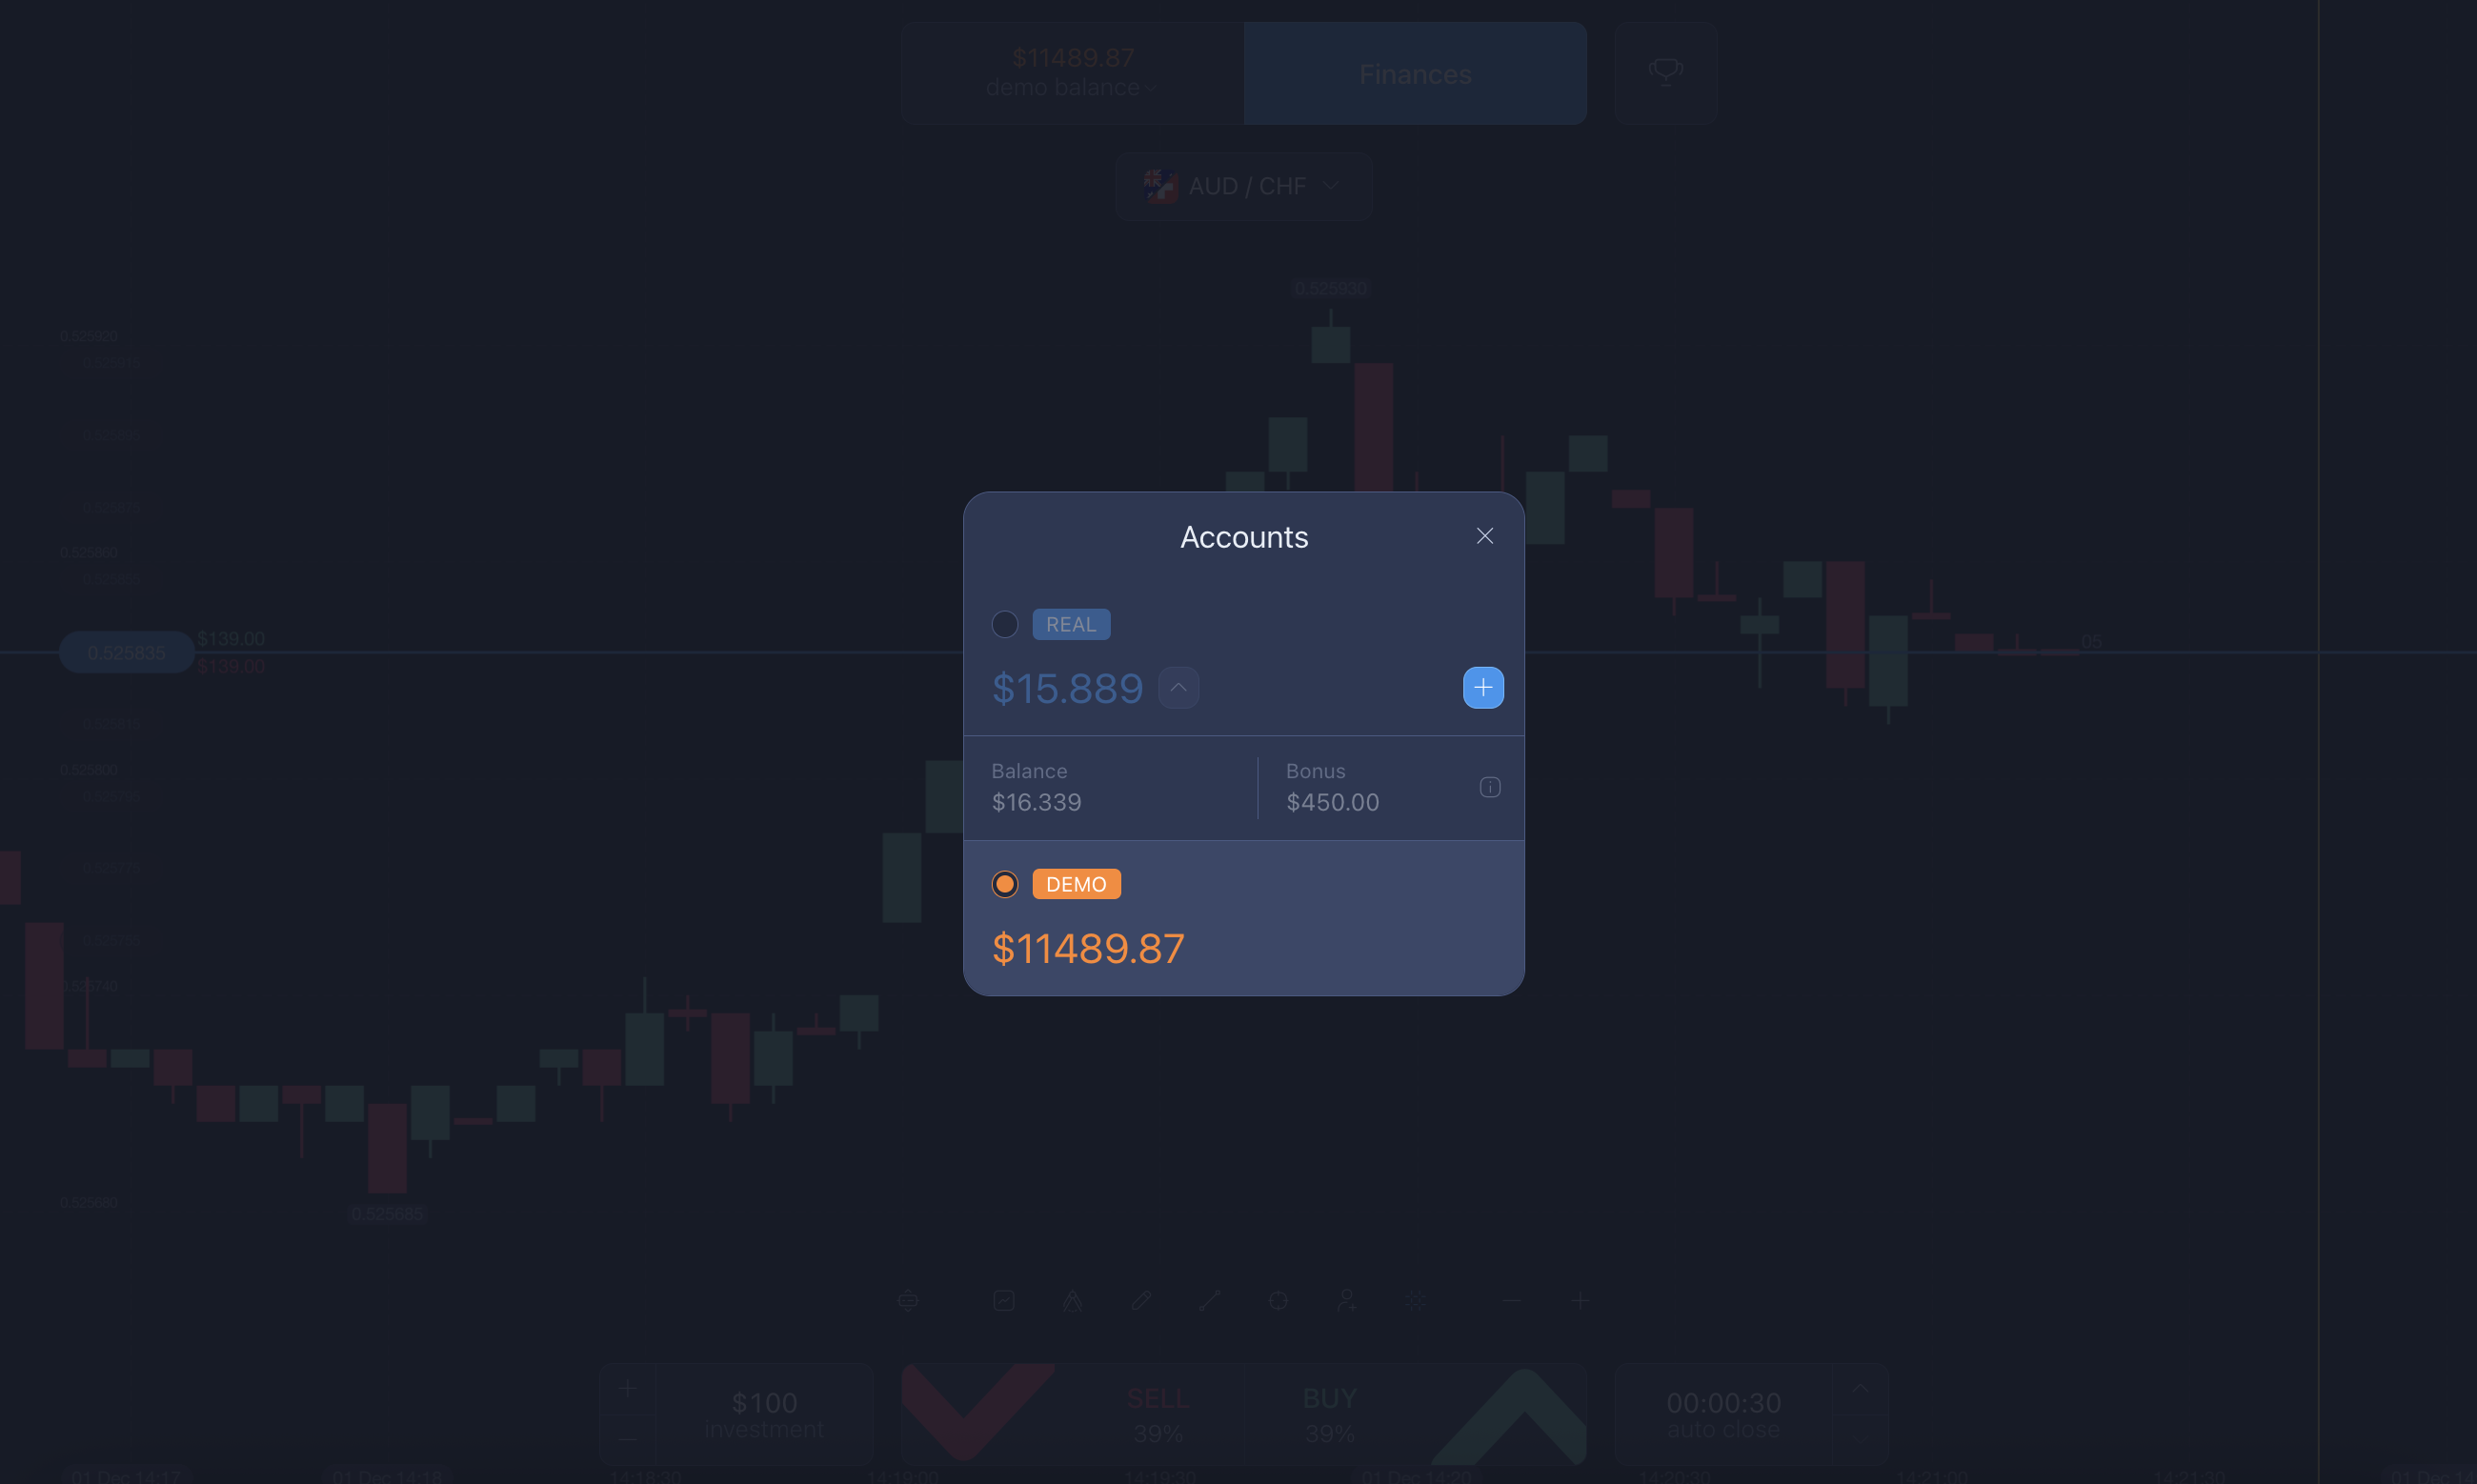
When you're relying on a platform's charts to make trading decisions, accuracy matters. Look for real-time price data, indicators that update without lag, and a chart that doesn't freeze or glitch mid-session — small delays or errors can throw off a signal like an engulfing candle just enough to matter. ExpertOption's charts run on live market data, both on the real account and demo, which is a low-pressure way to get a feel for how the platform handles this before you commit real funds. You can practice spotting engulfing candles, layering on indicators, and reading the signals with virtual money first, so by the time you're trading live, the charts and tools already feel familiar.
Using the Engulfing Candle As Part of Your Trading Strategy
Once you can reliably spot bullish and bearish engulfing patterns, the next step is figuring out where they fit into a broader strategy rather than treating each one as an instant trade signal.
Once a bullish or bearish engulfing candle has closed, and you've checked it against support and resistance, or a momentum indicator, placing the trade itself is easy on ExpertOption: pick your asset, set your trade amount, choose the direction that matches the pattern (up for a bullish engulfing candle, down for a bearish one), and confirm. The harder part is making sure you've done the reading beforehand, which is exactly what the rest of this section covers.
Is the Engulfing Candle the Best Trading Strategy Signal On Its Own?
On its own, an engulfing candle is just a hint, not a full strategy. It tells you that momentum might be changing, but it doesn't tell you how big the move will be, how long it will last, or whether the rest of the market actually backs up a reversal. The price could engulf the previous candle and still stall out a few sessions later, especially if nothing else on the chart supports the move.
Traders who treat every engulfing candle as an automatic buy or sell signal, without looking at anything else, often get caught out by false signals. This happens a lot in choppy or sideways markets, where candles swing back and forth without any real direction behind them. In those conditions, an engulfing pattern can show up simply because prices are jumping around, with no real shift actually taking place underneath it. That's why it works best as one input among several, rather than a signal to act on by itself.
Combining the Engulfing Candle With Other Trading Tips
A better way to use the engulfing candle is to treat it as just one piece of the puzzle, not the whole answer. A few trading tips to keep in mind:
- Wait for the candle to close before you act. Don't jump in while it's still forming.
- Check if it shows up near support or resistance. Location matters.
- Look at RSI or another momentum indicator too, to see if the market was overbought or oversold beforehand.
- Stick to longer timeframes when you can. The signals tend to be more reliable.
- Know your risk before you enter, no matter how strong the pattern looks.
Used this way, the engulfing candle becomes a helpful trigger inside a bigger set of rules — not something you chase on its own.
Common Trading Mistakes When Reading Engulfing Candles
Even once you understand the pattern, a few trading mistakes show up repeatedly among traders who rely on it:
- Acting before the candle fully closes. A pattern that looks like an engulfing formation mid-session can change shape entirely by the close, so entering too early is a common error.
- Ignoring the broader trend. An engulfing candle that appears in a sideways, directionless market carries far less significance than one that shows up after a clear, established trend.
- Skipping confirmation. Trading the pattern in isolation, without checking volume, support and resistance, or a momentum indicator, leaves you relying on a single, imperfect signal.
- Overlooking the timeframe. A pattern on a very short timeframe is far noisier and less reliable than the same shape on a daily or four-hour chart.
- Forgetting risk management. Even a well-confirmed engulfing pattern can fail. Trading it without a predefined stop-loss or exit plan turns a reasonable setup into an unnecessary gamble.
Paying attention to your own habits, not just the chart patterns, is usually what separates traders who use engulfing candles well from those who keep getting burned (excuse the pun) by them. Like any tool in technical analysis, it works best when it's part of a plan you've actually tested and stuck with, not something you reach for on a whim.
Final Thoughts
The engulfing candle is one of the more accessible patterns in technical analysis — easy to spot once you know the shape, and useful when read in context. Its real value shows up when it's paired with support and resistance levels, confirmed with a momentum indicator, and treated as one signal among several rather than a shortcut to a decision.
Study how bullish and bearish engulfing patterns play out across different assets and timeframes before trading them live. With practice and a bit of discipline around confirmation and risk management, this simple two-candle formation can become a reliable piece of a much larger trading strategy.
Latest Posts
Trading Education
Trading News
Trading Strategies
Promotions & Tournaments
Success Stories & Tips
Platform Updates
Global events, stocks, crypto, forex
ExpertOption Reviews: An Honest Overview and Tips from Traders
5 minutes to readExpertOption Withdrawal Policy: How Withdrawals Work and Why Balance Management Matters
5 minutes to readExpertOption Reviews: An Honest Overview and Tips from Traders
5 minutes to readExpertOption Withdrawal Policy: How Withdrawals Work and Why Balance Management Matters
5 minutes to read