



 10 minutes to read
2026-04-07
Jagbir Singh
Exploring Chart Options: ExpertOption


Charts are the visual language of trading. On ExpertOption, chart options allow users to see how prices move, how trends develop, and where market behavior may shift. For beginners, especially, understanding chart formats is just as important as learning how orders or balances work.
Chart customization has become increasingly important because traders rely more on technical charting to interpret fast-moving markets. Clear visuals reduce confusion, help users stay focused, and support more structured market analysis.
This guide is designed for beginners, visual learners, and strategy-focused traders who want to understand how ExpertOption charts work and how to use them comfortably on a secure platform.
Visit our website to explore the platform and create your account.
Why Chart Options Matter
Choosing the right chart type can completely change how the market looks. Some charts highlight overall direction, while others focus on detail and short-term fluctuations.
Learning how chart styles behave early helps users avoid misreading price movements. For example, what appears as a sudden move on one chart might look like a normal fluctuation on another. Proper chart usage builds clarity and reduces decision-making mistakes caused by visual misunderstandings.
Charts are not predictions; they are tools for interpreting information. When used correctly, they make price behavior easier to read and compare over time.
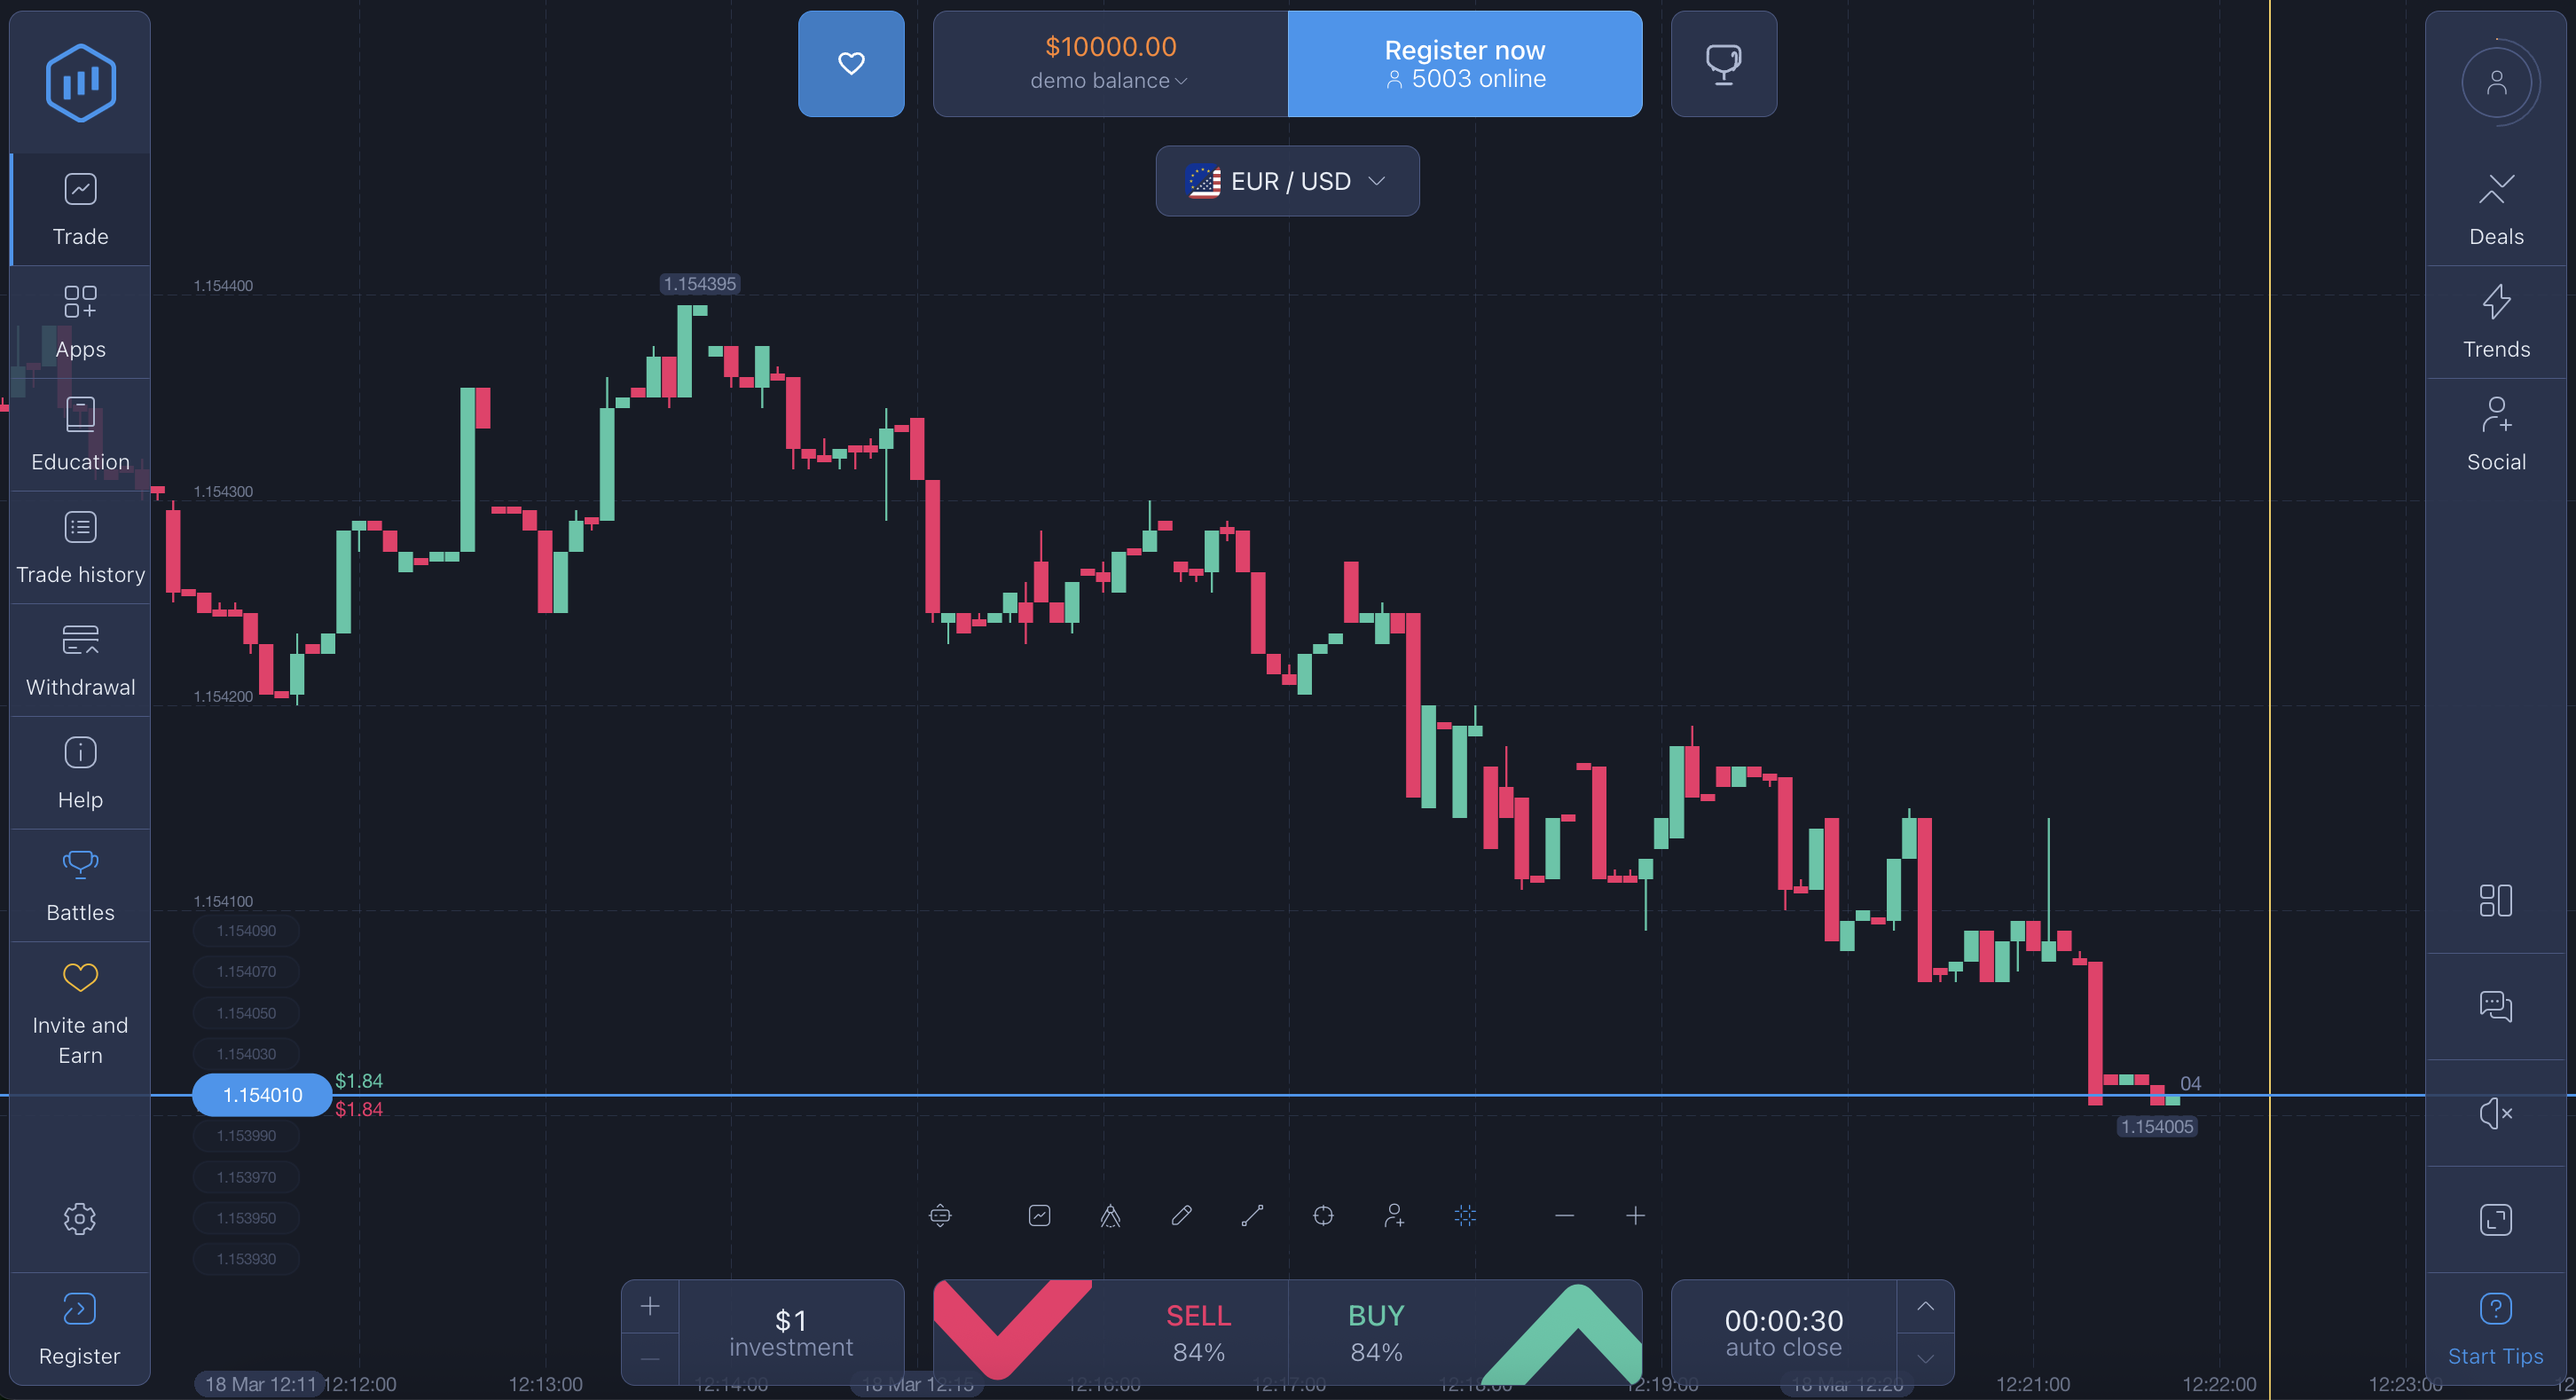
Understanding ExpertOption Chart Types
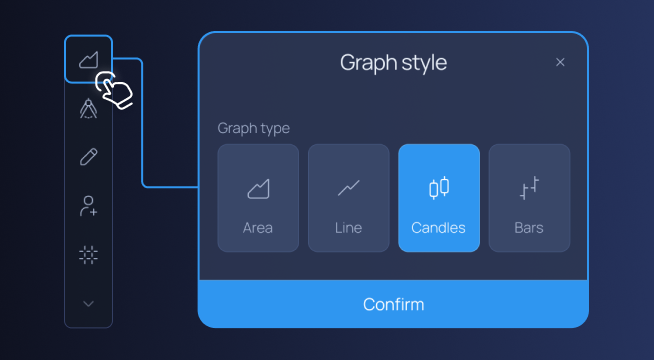
ExpertOption provides multiple chart formats so traders can match visuals to their personal preferences and analysis style. Each chart shows the same market data but presents it differently.
Line Chart
A line chart connects closing prices over time. It provides a smooth and simple view of the general direction.
This format works well for beginners because it removes visual noise and highlights the main trend. It is often used when traders want a quick overview rather than a detailed analysis.
Candlestick Chart
Candlestick charts are widely used in technical charting. Each candle shows four key prices: open, close, high, and low.
The body and wicks visually display market activity within a chosen timeframe. This helps traders see volatility, momentum, and pauses in movement more clearly than a line chart.
Bar Chart
Bar charts present the same data as candlesticks but in a different visual structure. They can appear less intuitive for beginners, but are valued by some traders for their precision.
This format is often chosen by users who already understand price structure and prefer a minimalist look.
Area Chart
An area chart resembles a line chart but fills the space below the line. It emphasizes overall direction and can make trends feel more visually noticeable.
This type is useful for those who want a more visual representation of movement without focusing heavily on details.
Each chart type serves a different purpose. Switching between them can offer a broader understanding of how the market behaves.
Why Chart Customization Is Important
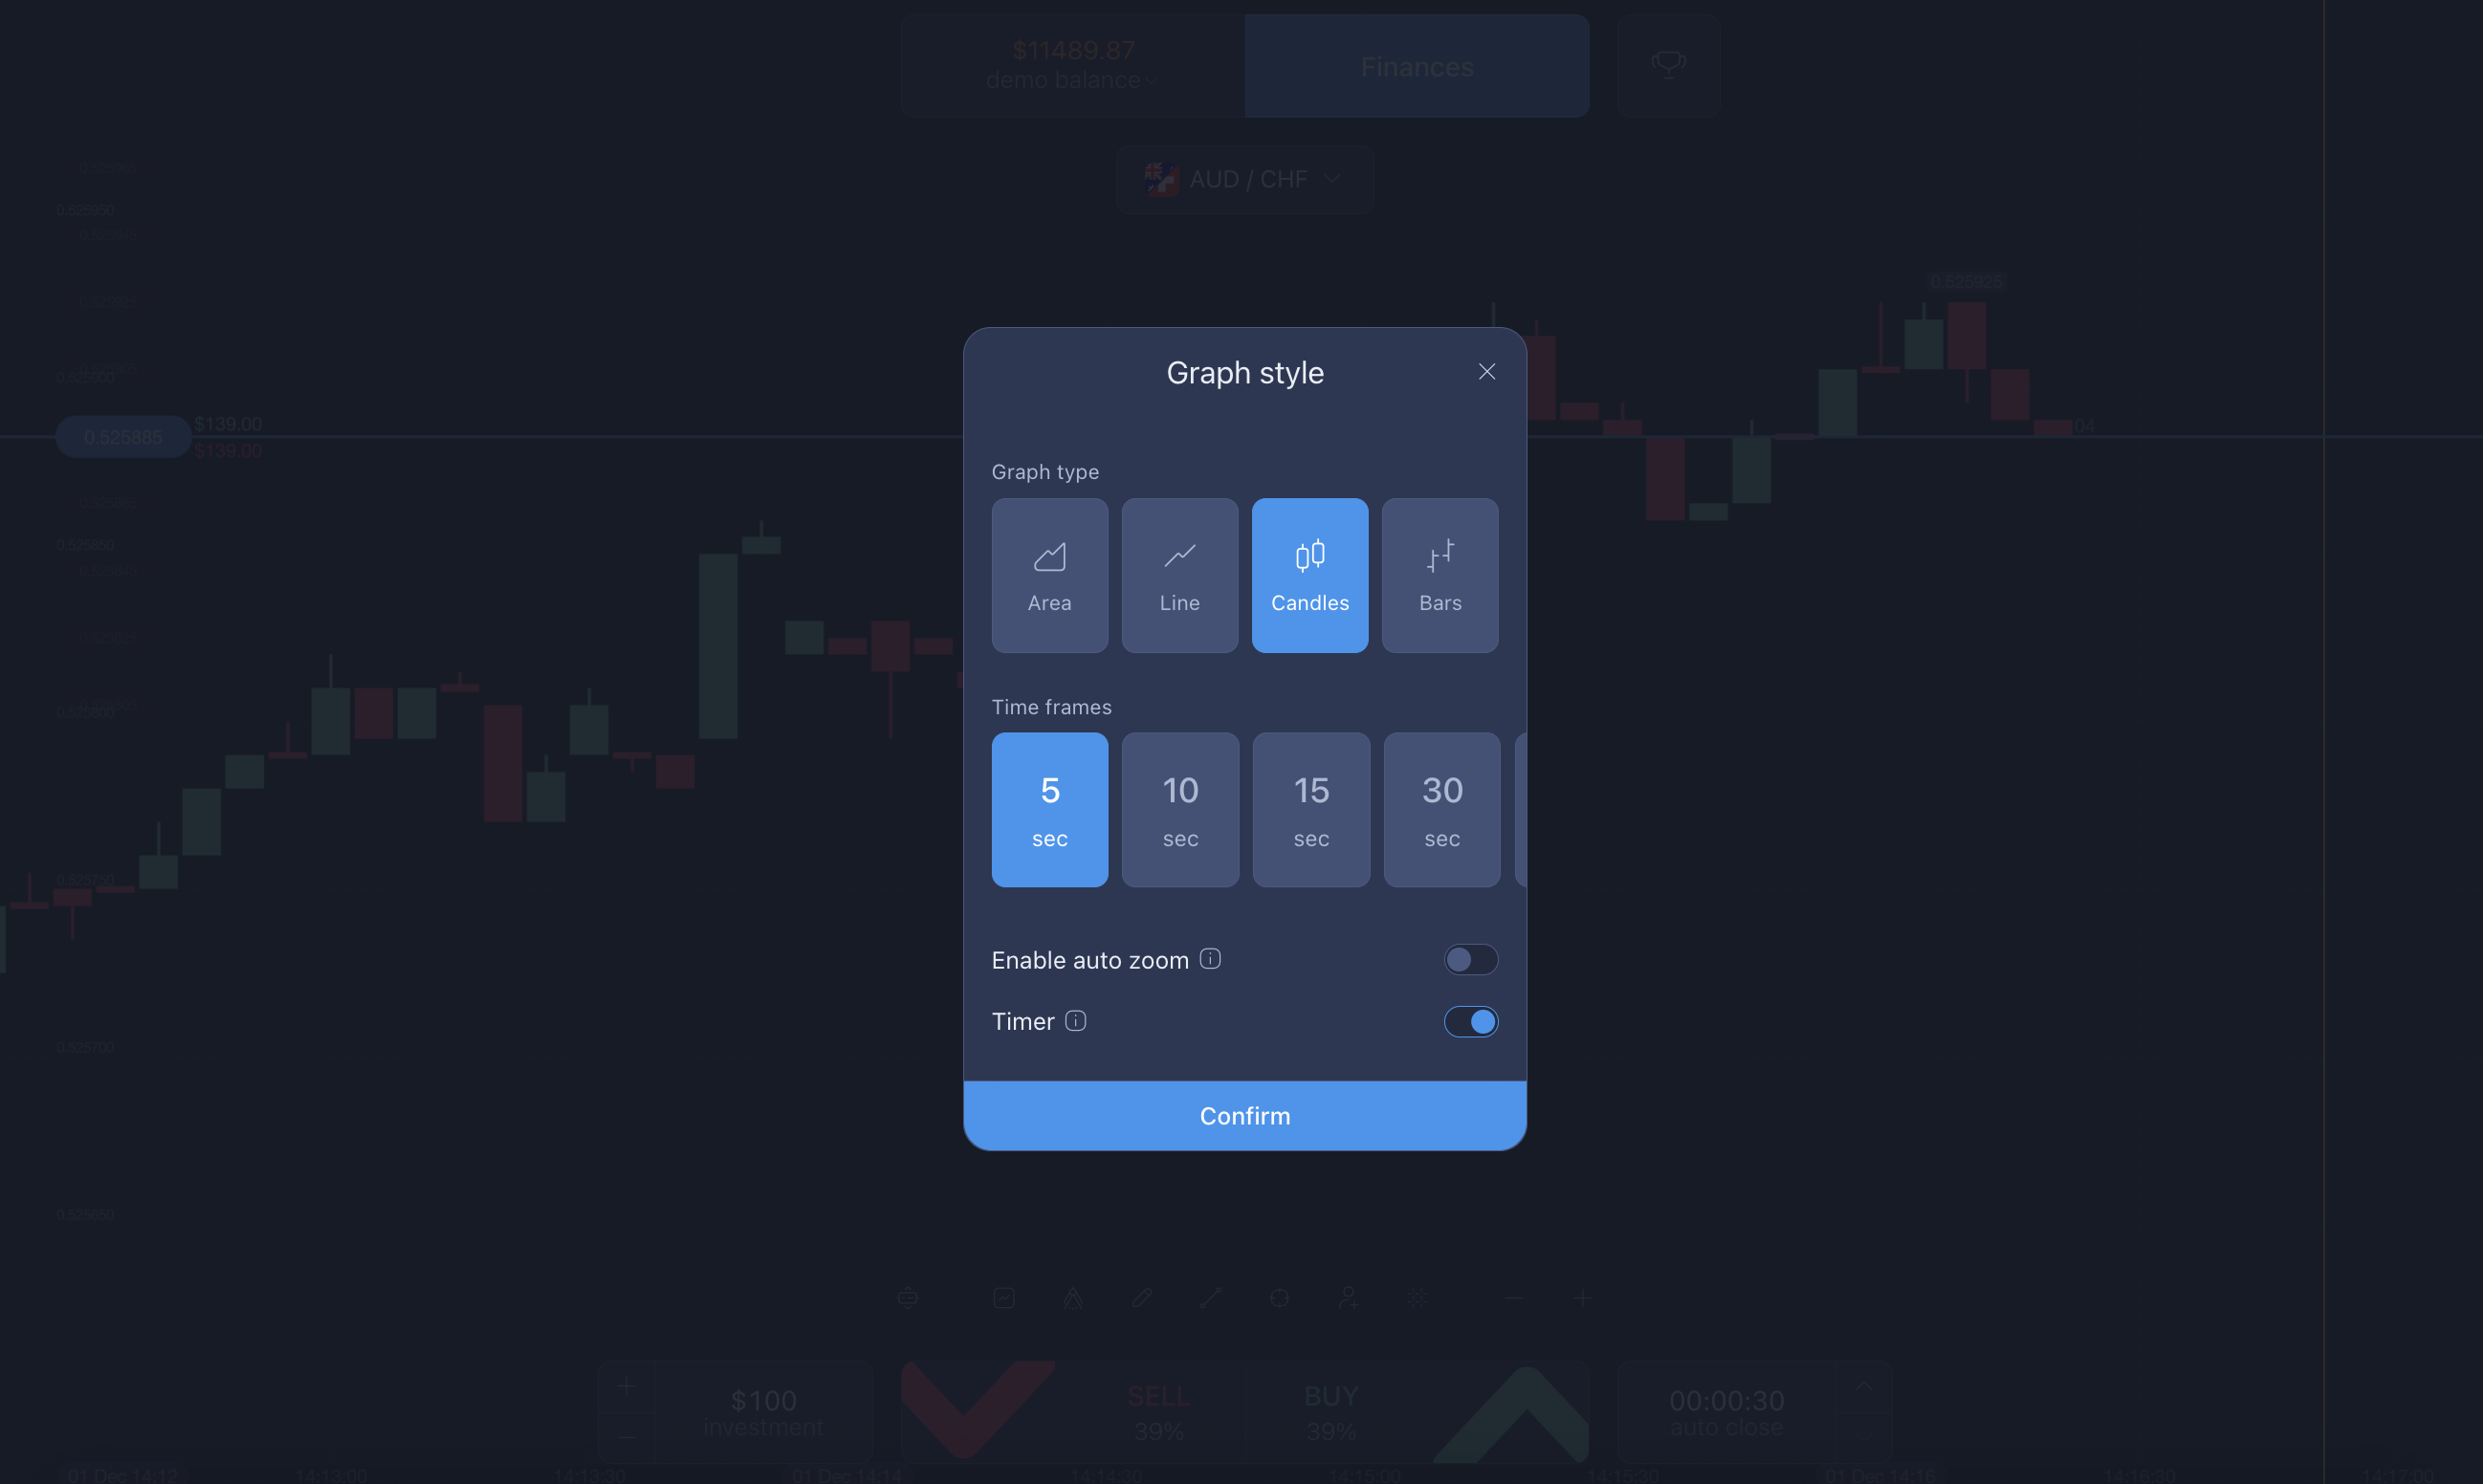
Default chart settings may not match every user’s needs. Adjusting colors, timeframes, and scaling improves readability and reduces visual strain.
Clear customization prevents misinterpretation. For example, zooming in too much may exaggerate small movements, while zooming out too far can hide important price changes. Aligning chart settings with personal strategy creates consistency. When visuals stay familiar, traders can focus more on analysis and less on figuring out what they’re seeing.
Customization also supports better decision-making by keeping charts organized and easier to follow during active market periods.
Key Benefits of Using the Right Chart
Using the correct chart type can improve how comfortably a trader reads market conditions. It also supports a smoother workflow during market analysis.
When visuals match the trader’s style, identifying trends, support areas, and resistance levels becomes more intuitive. This does not guarantee outcomes but helps reduce confusion caused by unclear displays.
A well-adjusted chart also saves time. Instead of struggling to interpret data, users can focus on observing price behavior.
How Charts Help Reduce Emotional Trading
Trading can be stressful, especially for beginners. It’s easy to make impulsive decisions based on fear or excitement, but that often leads to losses. ExpertOption provides charts and tools to help traders make informed, thoughtful decisions, not to encourage gambling.
Charts give you a clear view of market trends and price movements, helping you plan entries and exits ahead of time. By focusing on real data rather than gut reactions, you can trade more calmly and consistently.
With options like line charts, candlesticks, and real-time price updates, along with customizable timeframes and indicators, these tools help you see the market from different angles. They’re designed to support strategy and analysis, making trading a skill-based activity rather than a game of chance.
In short, ExpertOption’s charts are there to help you trade with discipline and confidence, keeping decisions grounded in data — not relying on luck.
Who Should Follow This Guide
This guide is especially helpful for beginners who are still learning to interpret charts. It also supports traders who feel uncertain when looking at price movements or who want to refine their analysis process.
Users aiming to build confidence in technical charting will benefit from understanding how different chart styles influence perception.
Affiliate marketers and social media traders who explain markets to others may also find value in understanding these visual tools more deeply.
Common Mistakes to Avoid
Many traders stick to one chart style without exploring others. While familiarity is helpful, different situations may require different visual perspectives.
Relying only on default settings can also create problems. Timeframes, scaling, and zoom levels significantly affect how movements appear. Ignoring timeframes is another common issue. A pattern on a short timeframe may look completely different on a longer one.
Emotional reactions to unclear visuals can lead to rushed decisions. Taking time to adjust chart settings often restores clarity.
How Charts Connect to Account Tools
Charts are part of a broader system within ExpertOption. While they support market analysis, account features such as ExpertOption verification and the ExpertOption payout system relate to account management rather than chart usage.
A smooth trading experience involves both clear chart interpretation and organized account procedures. For example, keeping documents updated simplifies processes later if using a payout checklist during withdrawals.
Understanding that charts support analysis, while verification and payouts support account access, helps users separate market decisions from administrative tasks.
Same Market, Different Perspectives: How Chart Types Affect Perception
Imagine two beginners observing the same asset. One uses a line chart and sees a steady upward path. The other uses candlesticks and notices frequent pullbacks within that trend.
The market and its conditions are the same for both traders — the only difference is the method of perception. Both are correct; the candlestick user may focus on short-term fluctuations, while the line chart user tracks the overall direction.
Switching chart types allows traders to gain a more balanced understanding of the market’s behavior, combining both short-term movements and the broader trend.
FAQ
Does ExpertOption alter chart data?
No. ExpertOption does not modify or manipulate chart data. All charts reflect the same underlying market prices provided by liquidity sources. The platform displays real-time price information as received, and any differences users notice are related to chart type or timeframe selection, not changes to the data itself.
Do chart types change market prices?
No. Chart formats only affect how price information is displayed on your screen. The underlying market data, such as open, close, high, and low prices, remains the same regardless of the visual format. Changing a chart type helps you view the market differently, but it does not influence price movement itself.
Which chart is best for beginners?
Many beginners start with line charts because they are simple and easy to read. They highlight the overall direction without too much detail. As users become more comfortable, candlestick charts are often introduced, since they provide deeper insight for technical charting, including volatility and short-term price behavior.
Why do the same movements look different on different charts?
Each chart emphasizes different elements of price data. A line chart usually focuses on closing prices, creating a smoother appearance. Candlestick and bar charts display the full price range within a timeframe, which can make movements appear more active or volatile. The market is the same — only the perspective changes.
Can chart customization affect results?
Customization improves clarity, not performance. Adjusting colors, zoom levels, or timeframes helps users read charts more comfortably and reduce visual confusion. Better readability can support more structured analysis, but it does not guarantee outcomes.
Are charts connected to ExpertOption payout processes?
No. Charts are analytical tools used for market observation. ExpertOption payout procedures and ExpertOption verification relate to account management and fund withdrawals. These systems operate separately from chart settings, so visual preferences do not affect payment processing.
You can explore helpful information about the platform in our blog.
Final Thoughts
Chart options in ExpertOption act as visual guides that turn raw price data into something easier to understand. When traders learn how different chart types work, how to adjust their appearance, and how to read what they show, market analysis becomes more structured and less overwhelming.
This clearer understanding is what helps confidence grow. As beginners become more comfortable interpreting price movements, they are better able to stay calm and make controlled decisions instead of reacting impulsively. When this approach is supported by good account habits, such as completing ExpertOption verification and using a payout checklist when needed, the entire trading experience feels more organized and secure.
Charts do not predict results, but they do improve comprehension. That clarity is often the first step toward confidence, and confidence leads to more deliberate decision-making. For best results, charts should be used alongside regular practice, demo modes, and gradual learning, rather than as standalone tools.
Latest Posts
Trading Education
Trading News
Trading Strategies
Promotions & Tournaments
Success Stories & Tips
Platform Updates
Global events, stocks, crypto, forex
ExpertOption Reviews: An Honest Overview and Tips from Traders
5 minutes to readExpertOption Withdrawal Policy: How Withdrawals Work and Why Balance Management Matters
5 minutes to readExpertOption Reviews: An Honest Overview and Tips from Traders
5 minutes to readExpertOption Withdrawal Policy: How Withdrawals Work and Why Balance Management Matters
5 minutes to read